E-Biking in Numbers: Why Electric Cycling Is Transforming Travel, Tourism & Daily Mobility
- Dec 7, 2025
- 4 min read

Our Zyflow Vision
At Zyflow, our mission is to make e-biking easier, safer, and more enjoyable for every rider. We believe that e-cyclists deserve access to clear, reliable and practical information — from charging locations and route planning to safety, infrastructure and tourism insights.
By publishing data-driven articles like this one, we aim to support e-bike users with valuable knowledge, while also encouraging all creators of the e-bike ecosystem — destinations, service providers, infrastructure developers and policymakers — to recognize the growing importance of this segment and make their environment more accessible and e-bike friendly.
Our vision is simple:a world where every e-cyclist can ride with confidence, explore freely, and enjoy a seamless experience supported by thoughtful infrastructure.
Introduction: E-bikes as the driver of new mobility
Electric bikes are no longer a niche trend — they are reshaping mobility, tourism, infrastructure planning and the way millions of Europeans explore their surroundings. The data is clear: e-biking is one of the fastest-growing mobility segments, influencing industries from tourism to urban planning. Below is an evidence-based overview of the key numbers, trends and insights powering this shift. (All primary data points sourced from the attached evidence pack.)
1. The European E-Bike Boom: Market Growth in Hard Numbers
Across Europe, e-bikes have become the driving force of electric mobility, outperforming traditional cycling in both sales and usage.
Germany Leads the Charge
According to ZIV (2024):
2.05 million e-bikes sold in a single year
E-bikes now represent 53% of all bikes sold
Industry experts call e-bikes the "engine of electric mobility"
Europe’s Wider Market Trend
(CONEBI, 2024)
Conventional bicycle sales are declining
E-bike sales remain 50% above pre-pandemic levels
Average annual market growth (2019–2024): +17%
Digital Interest in Cycle Tourism Is Surging
(EuroVelo, 2024)
1.8+ million website sessions
+9.8% more users on EuroVelo routes compared to 2019
Netherlands: A Mature E-Bike Nation
(Fietsplatform, 2022)
52% of recreational cyclists use an e-bike
Up from 32% in 2016
Conclusion: E-biking has moved from niche recreation to mainstream mobility — and the numbers show the trend isn’t slowing.

This graphic presents Europe e-bike statistics on spending, stay duration, and regional growth, showing how e-biking strengthens local tourism economies.
2. Understanding the E-Bike Tourist: Who They Are and What They Need
E-bike travellers behave differently from classic cyclists. They plan differently, ride differently and spend differently.
Demographics
Fastest-growing group: 45+ travellers
Often couples or families
Looking for comfort, authenticity and lightly active outdoor experiences
Behaviour on the Road
Plan routes based on battery range, elevation and charging point availability
Typical day trip: 30–50 km
More than half ride in pairs

This visual explains essential e-bike trends in route planning — from battery range and charging availability to elevation profiles and stop preferences.
Industry Insights
(ATTA & ECF, 2024)
64% of tour operators say at least a quarter of their guests use e-bikes
38% of European operators report over 50% e-bike guests
Key challenges: inflation, charging logistics, transport, and insufficient infrastructure
Motivations
Less sport-oriented, more experience-oriented
Prioritize safety, comfort and meaningful stops (culture, nature, food)
Conclusion:
E-cyclists are higher-spending, experience-driven tourists who demand a reliable support system — both physical and digital.

3. Infrastructure Standards: What Europe Says E-Cyclists Need
European guidelines (ECS, UNECE) already define minimum expectations for safe and enjoyable e-biking.
Charging & Service Points
Per ECS (2021):
At least one charging point per daily route section
A repair stand or toolkit
Access to water and food
Navigation Standards
Clear, frequent route confirmations
Night-visible signage
Distance/time information to the next charging point
Integration with Public Transport
(UNECE, 2025)
Options to carry e-bikes on trains/buses across 75–150 km
Digital mapping should include transit hubs
Route Safety Requirements
Slopes: 3–6%
Smooth asphalt surfaces
Minimal mixing with motor traffic
Separated lanes at higher speeds
Theft Prevention Measures
Europe registers hundreds of thousands of bicycle thefts annually(e.g., 928,000 cases in the Netherlands alone in 2023)
Recommended:
Secure parking with surveillance
Certified locks
GPS-enabled tracking solutions
Conclusion:
Meeting these infrastructure expectations is essential for any region that wants to attract e-bike tourists.
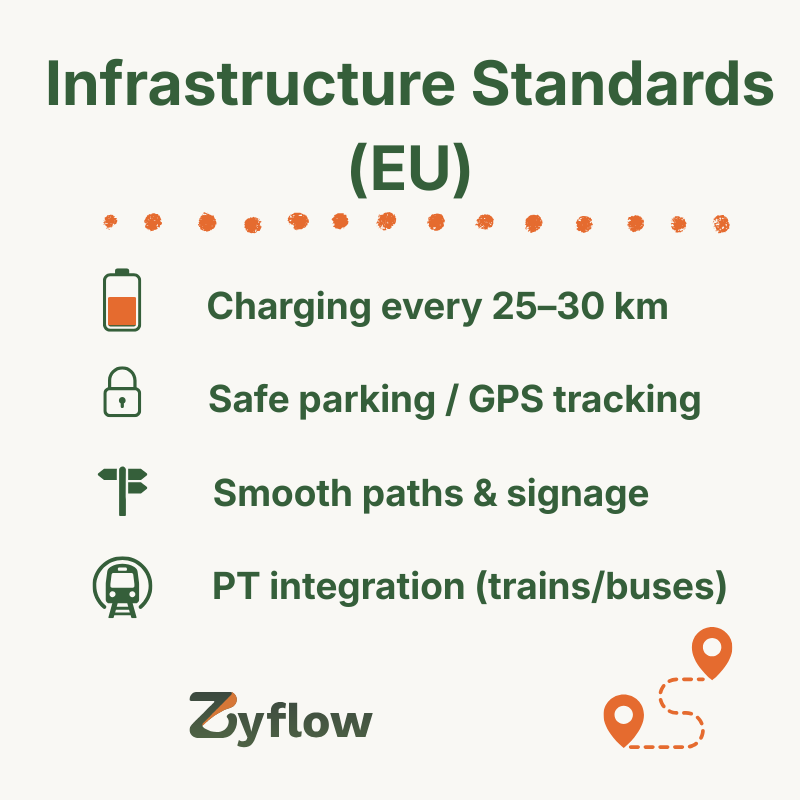
This infographic summarises the future of e-biking in Europe, covering charging, signage, safety requirements, and public transport integration.
4. What Destinations Must Do: A Practical Roadmap
Based on European guidelines and best practices, tourism regions should implement:
1. Dense Charging Network
One charging station every 25–30 km
2. Service Availability
Self-service repair points
Compressors, toolkits, first-aid stations
3. Standardized Signage
Aligned with UNECE and ECS guidelines
4. Integrated Tourism Ecosystem
Accommodation
Restaurants, cafés
Natural and cultural attractions
5. Safe Parking Solutions
Theft-proof racks
Video monitoring
Support for GPS locks and smart tracking
6. Digitally Connected Experience
Real-time maps
Notifications
Route planning tools
Integration with charging infrastructure
7. Data & Analytics
GIS / IoT systems for monitoring usage patterns
Data-driven planning for funding and upgrades
Conclusion:
Destinations that embrace e-bike infrastructure will gain a competitive advantage — attracting new tourist groups with high spending power.

This visual outlines future e-biking opportunities for destinations — from integrated tourism offers to digital mapping and IoT data
5. Why This Matters: E-Bikes as an Engine for Tourism, Health & Sustainability
E-biking brings:
Increased tourism revenue
Longer stays and higher spending
Health and wellbeing benefits
Lower carbon emissions
Development of rural and cross-border areas
New business opportunities (charging, rental, transport, insurance, tours)
The shift is structural, not temporary — and regions that move early will gain the most.

Closing invitations to the community
As we continue mapping the rapidly growing world of e-biking, we would love to include experiences from those who are shaping it. If your destination, business or community is already creating e-bike-friendly spaces, routes or services, we invite you to share your story with us — your example can inspire others to follow.
And to all e-bike riders: if you’ve discovered charging spots, safe parking, scenic routes, welcoming cafés or helpful services, your tips can make a real difference for fellow cyclists.
Every contribution helps us bring more clarity to the e-bike ecosystem and build a future where riding is easier, safer and more enjoyable for everyone.
Sources
Primary data sourced from your attached document:
Additional contextual confirmation based on:
CONEBI Market Report 2024
ZIV – German Bicycle Industry Association
EuroVelo Traffic & Engagement Report 2024
UNECE Guide for Cycle Route Networks (2025)
ECF (European Cyclists’ Federation) Infrastructure Guidelines
ATTA Cycling Tourism Industry Insights 2024


Comments